Cleanup #
I’ve spent some time today cleaning up formatting and testing usability.
When mbuf_trace option is disabled all mtrace_* and mtrace calls are #defined as empty.
I also stopped outputing the contents of mbufs implicitly. If the packet is “getting consumed” it won’t make sense to dump its contents. More importantly, mbufs can be modified in-place at various places. For that reason it made sense to add explicit content tracing - mtrace_data.
API #
mtrace_start(m)
mtrace_data(m)
mtrace_printf(m, f, ...)
mtrace_static_length(m, s, l)
mtrace_static(m, s)
mtrace_dynamic_length(m, s, l)
mtrace_dynamic(m, s)
mtrace(m, s)
mtrace_(m)
mtrace_enter(m)
mtrace_leave(m)
mtrace_func(m)
mis a pointer to astruct mbuf.sis a pointer to an array ofchar.mtrace_startstarts a trace. Tracing calls beforemtrace_startare ignored. This should allow us to add toggles for tracing on interfaces / firewall rules.lengthcalls take explicit length argumentl.- Calling
staticvariants should only be done with statically allocated strings - or at least with strings that will not be deallocated before the mbuf. - Calling
dynamiccopies the string so the string can be deallocated. mtraceis an alias formtrace_static.mtrace_captures__FILE__:__LINE__.mtrace_enter,mtrace_leaveandmtrace_funccapture__FILE__:__LINE__: X__func__, whereXis +, -, or nothing, respectively.
Enabling tracing #
Currently, there are 3 new sysctls when mbuf_trace is enabled:
kern.mbuf_trace.enable- enables / disables all tracing.kern.mbuf_trace.source_position- prepends__FILE__:__LINE__:to every trace string.kern.mbuf_trace.start_anywhere- disables checking if trace is already started. This makes it as if all mbufs have tracing started.
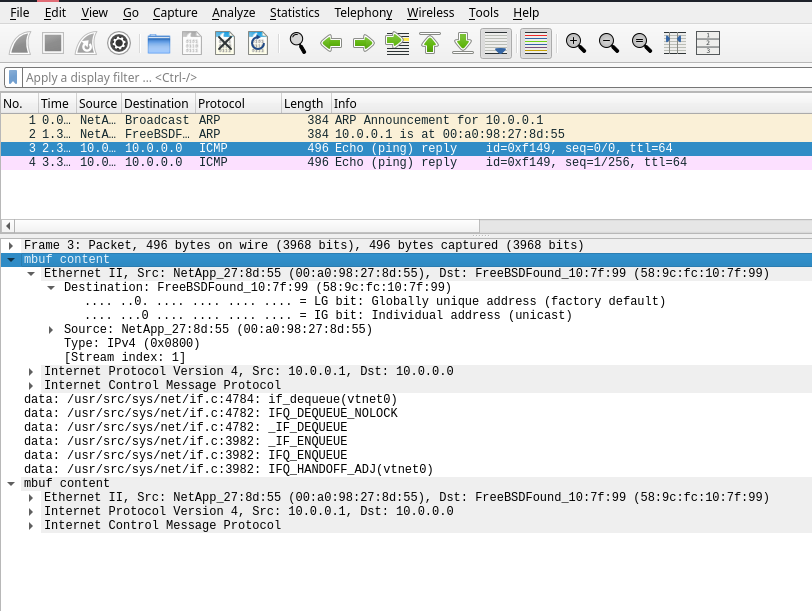
Capturing mbuf trace #
tcpdump on interface mbuf_trace.
Wireshark dissector code #
Paste the following into ~/.config/wireshark/plugins/mbuf_trace.lua:
local mbuf_trace_proto = Proto("mbuf_trace", "mbuf_trace Link-Layer")

local f_data = ProtoField.string("mbuf_trace.data", "trace")
mbuf_trace_proto.fields = { f_data }

function mbuf_trace_proto.dissector(tvbuf, pinfo, tree)
	pinfo.cols.protocol = "mbuf_trace"

	local pktlen = tvbuf:len()
	if pktlen < 2 then return end

	local offset = 0
	local count = tvbuf(offset,2):uint()
	offset = offset + 2

	local eth_dissector = Dissector.get("eth_withoutfcs") or Dissector.get("eth")

	for i = 1, count do
		if offset + 2 > pktlen then break end
		local rlen = tvbuf(offset, 2):uint()
		offset = offset + 2
		if offset + 2 > pktlen then break end
		local rtype = tvbuf(offset, 2):uint()
		offset = offset + 2
		if offset + rlen > pktlen then break end

		local data = tvbuf(offset, rlen);
		if rtype == 0 then -- ethernet
			local rec_tree = tree:add(mbuf_trace_proto, data, "data")
			eth_dissector:call(data:tvb(), pinfo, rec_tree)
		elseif rtype == 1 then -- string
			tree:add(f_data, data:string())
		end
		offset = offset + rlen
	end

	if offset < pktlen then
	end
end

DissectorTable.get("wtap_encap"):add(wtap.USER0, mbuf_trace_proto)
Here is an example PCAP file you can test it on.
TODO #
Would it be cool if ddb was able to dump traces?
Currently tracing is always enabled or disabled. I want to add toggles to:
- netgraph nodes
- network interfaces
- pf rules
- sockets (enabled at socket creation / after creation)
- processes (if start-start is enabled on a process, all mbufs that originate from it should have it enabled
- other ideas? contact me