Goal #
I want to be able to see how packets are being processed by the network stack. There is tcpdump, but it only shows me how packets are going through interfaces. Yes, I’m ignoring pflog and ipfw bpf devices - but it doesn’t matter as they still require me to assume in advance where the packet-of-interest is going to be going through.
Usually, I don’t really know whether the packet-of-interest is being process as expected but I’m able to tcpdump it as it is being received. It could be that I missed a firewall rule or… any other reason I can’t think of at the moment. It could also be the case that everything seems to be configured correctly but I’m just not sure. I want to be sure the packet is hitting all the rules / routing / netgraph nodes / VNETs I’m assuming it does. There’s currently no way to check the path of a single packet and it would be extremely tedious to set tracing up at each potential point just to be sure I’ve not missed a spot.
Furthermore, there is no way to know where in the kernel source code the packet was handled. This is more interesting to me from the debugging and development standpoint. I want to easily know all the places in code the packet touched. As of writing this post, I don’t know which order the packet processing steps really happen in. I have some guesses, but I really can’t easily give someone a clear image of when various subsystems come into play and how packets are transfered between them.
Using IMUNES you can create really complex virtual networks. Having this functionality would allow for the tool to give you a visual indication of where the traffic is really going through. Currently, using tcpdump and wireshark is the best option.
TL;DR #
I want to be able to track packets-of-interest by attaching extra data in the kernel to them that would allow me to get better insight.
The process #
“mbuf” is the name of the structure that represents packets in FreeBSD.
(TIP) FreeBSD formatting gives us a simple way to find out where definitions of structures and functions are - we just need to grep.
grep -rnw 'struct mbuf {' . shows as where mbuf is defined.
I tried adding a new field to the structure but the compilation failed because of an assertion that the size of the structure must be of a predetermined size.
I knew there must be a way to attach some data to mbufs because there are other systems that depend on that to mark packets and later recall that mark.
Skimming through sys/sys/mbuf.h I could see there is a concept of mtag.
It’s documented pretty good in the header itself with its usage being shown there in comments.
Greping for mentions of it in the whole codebase I could see how and why it is used.
I added a new tag type for the purpose of tracing - M_COOKIE_TRACE.
I also added a few functions which I will later scatter all over the kernel code that will add tracing data to the mbuf:
void mbuf_trace_static(struct mbuf *, char const *, uint32_t length);
void mbuf_trace_length(struct mbuf *, char const *, uint32_t length);
void mbuf_trace(struct mbuf *, char const *);
void mbuf_trace_printfv(struct mbuf *, char const *fmt, va_list);
void mbuf_trace_printf(struct mbuf *, char const *fmt, ...) __printflike(2, 3);

#define mbuf_trace_position__(mbuf, file, line) \
    mbuf_trace_static((mbuf), file ":" #line, __builtin_strlen(file ":" #line) + 1)
#define mbuf_trace_position_(mbuf, file, line) \
    mbuf_trace_position__((mbuf), file, line)
#define mbuf_trace_position(mbuf) \
    mbuf_trace_position_((mbuf), __FILE__, __LINE__)
I don’t intend for this to be the final API. I just want something simple for the prototype.
I implemented above functions so that they would add the data to the mbuf - I just had no way of reading that data back from the userspace.
I knew I wanted to be able to see it using tcpdump and wireshark but looking at tcpdump’s code that seemed like a big step.
So, for the first prototype I took inspiration from the rest of the code - I looked at how I can get any data in the simplest way back to the userspace.
Kernel C code seems to resemble userspace C code and printf can also be used.
It just appears in dmesg instead of FD 1.
I added mbuf_trace_position call to every function in sys/net/if.c that handles an mbuf.
Having implemented this, I felt confident I can manage to get to what I want.
I consulted with an experienced commiter and described to them what I did. I asked them for their opinion and if they could give me some pointers.
They told me to:
- Take a look at
ip_fw_bpf.cand see how it is creating a BPF tap. - Check out SDT (statically defined tracepoints) that are used for DTRACE.
ip_fw_bpf.c
#
I copied all the code from the file and started just renaming things from ipfw to mbuf_trace.
While renaming I looked at what it does and it seemed like I wouldn’t need that much.
It creates a red-black tree where it stores taps.
I only intent to have 1 tap so I removed all that code.
I think it also doesn’t make sense to VNET this as I want to be able to trace packets across VNETs so I took out that code, too. (I haven’t tested that it works, though, yet.)
I ended up with just a few important lines:
static bool
bpf_mbuf_trace_chkdir(void *arg __unused, const struct mbuf *m, int dir)
{
    return ((dir == BPF_D_IN && m_rcvif(m) == NULL) ||
        (dir == BPF_D_OUT && m_rcvif(m) != NULL));
}

static const struct bif_methods bpf_mbuf_trace_methods = {
    .bif_chkdir = bpf_mbuf_trace_chkdir,
};

static struct bpf_if *mbuf_trace_tap;

static void
mbuf_trace_init(void *dummy)
{
    printf("mbuf trace loaded!\n");
	mbuf_trace_tap = bpf_attach("mbuf_trace", DLT_USER0, 0,
	    &bpf_mbuf_trace_methods, NULL);
}
SYSINIT(mbuf_trace_init, SI_SUB_PROTO_FIREWALL, SI_ORDER_ANY, mbuf_trace_init, NULL);

void
mbuf_trace_dump(struct mbuf *m)
{
    if (!bpf_peers_present(mbuf_trace_tap))
        return;
    /* <TODO: actually dump the trace> */
}
I haven’t yet looked at what .bif_chkdir is doing but it seemed important so I just copied it.
I didn’t know which link-layer protocol to put as it’s a new one I’m creating for the purpose of tracing, so I used DLT_USER0.
After compiling and installing the kernel, I tried tcpdump -i mbuf_trace and … it worked!
It was waiting for data.
I made m_free call mbuf_trace_dump before freeing the mbuf and implemented the rest of the mbuf_trace_dump:
void
mbuf_trace_dump(struct mbuf *m)
{
    if (!bpf_peers_present(mbuf_trace_tap))
        return;

	uint32_t total_size = 2; // count
	uint16_t count = 0;
	struct m_tag *tag;
	SLIST_FOREACH(tag, &m->m_pkthdr.tags, m_tag_link) {
		if (tag->m_tag_cookie == M_COOKIE_TRACE) {
			KASSERT(tag->m_tag_id == 0,
			    ("%s invalid id", __func__));
			count++;
			struct mbuf_trace *t = (struct mbuf_trace *)(tag + 1);
			total_size += 2; // length
			total_size += t->strlen;
		}
	}
	if(count == 0)
		return;

	void *trace = __builtin_alloca(total_size);
	uint8_t *at = trace;
	*at++ = (count >> 0) & 0xFF;
	*at++ = (count >> 8) & 0xFF;
	SLIST_FOREACH(tag, &m->m_pkthdr.tags, m_tag_link) {
		if (tag->m_tag_cookie == M_COOKIE_TRACE) {
			KASSERT(tag->m_tag_id == 0,
			    ("%s invalid id", __func__));
			struct mbuf_trace *t = (struct mbuf_trace *)(tag + 1);
			*at++ = (t->strlen >> 0) & 0xFF;
			*at++ = (t->strlen >> 8) & 0xFF;
			if (t->is_static) {
				memcpy(at, *t->string_static, t->strlen);
			} else {
				memcpy(at, t->string, t->strlen);
			}
			at += t->strlen;
		}
	}
	bpf_mtap2(mbuf_trace_tap, trace, total_size, m);
}
When testing this I saw that that all the data was there!
I wrote a lua dissector for wireshark that grabs the data:
local mbuf_trace_proto = Proto("mbuf_trace", "mbuf_trace Link-Layer")
local f_rdata  = ProtoField.string("mbuf_trace.data", "data")
mbuf_trace_proto.fields = { f_rdata }

function mbuf_trace_proto.dissector(tvbuf, pinfo, tree)
	pinfo.cols.protocol = "mbuf_trace"
	local pktlen = tvbuf:len()
	if pktlen < 2 then return end

	local offset = 0
	local count = tvbuf(offset,2):uint()
	offset = offset + 2

	local subtree = tree:add(mbuf_trace_proto, tvbuf(), "mbuf trace")
	for i = 1, count do
		if offset + 2 > pktlen then break end
		local rlen = tvbuf(offset,2):uint()
		offset = offset + 2
		if offset + rlen > pktlen then break end

		local data_str = tvbuf(offset, rlen):string()
		subtree:add(f_rdata, tvbuf(offset, rlen))
		:set_text(string.format("%s", data_str))

		offset = offset + rlen
	end

	if offset < pktlen then
		local eth_dissector = Dissector.get("eth_withoutfcs") or Dissector.get("eth")
		if eth_dissector then
			eth_dissector:call(tvbuf(offset):tvb(), pinfo, tree)
		else
			tree:add_expert_info(PI_UNDECODED, PI_NOTE, "Ethernet dissector not found")
		end
	end
end

DissectorTable.get("wtap_encap"):add(wtap.USER0, mbuf_trace_proto)
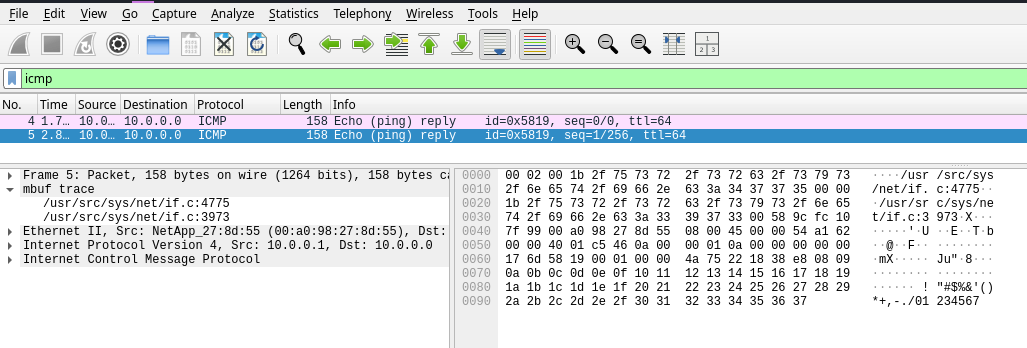
The result #
Pinging the VM from the host and capturing traces in the VM using tcpdump -i mbuf_trace -w a.pcap i got the following result:
Future work #
- Clean up the code a bit.
- Investigate SDT and how DTRACE inserts code dynamically as to minimize runtime impact when tracepoints are not present. I suspect I’m going to want to use something a bit more generic for this - like zcond.
- Add mechanisms and tunables that allow me to turn ON/OFF tracing on individual packets by only starting tracing only in places (interfaces, rules, ng nodes) of interest.
- Use zcond instead of checking global booleans.
- Add a bunch of trace points in the code.
It would be nice to be able to tell the C compiler to insert a call to the tracing macro to every function that takes
struct mbuf *as input and before every return that gives result of typestruct mbuf *. Unfortunately, C is pretty bad for this and I will have to go manually through a lot of code - making a lot of changes and adding visual noise to the code. Hopefully people will find this feature useful enough to keep it in the source. - Submitting the code to review.
Feedback #
Please contact me if you have any feedback. :)